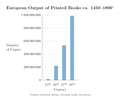
Fáìlì:European Output of Books 500–1800.png
Page contents not supported in other languages.
Lát'ọwọ́ Wiktionary

Ìtóbi ìkọ́yẹ̀wò yìí: 800 × 531 pixels. Àwọn ìgbéhàn míràn: 320 × 212 pixels | 640 × 425 pixels | 1,024 × 680 pixels | 1,436 × 953 pixels.
Fáìlì àtìbẹ̀rẹ̀ (1,436 × 953 pixel, ìtóbi faili: 64 KB, irú MIME: image/png)
Fáìlì yìí wá láti Wikimedia Commons, ó sì ṣe é lò nínú àwọn iṣẹ́ ọwọ́ míràn. Ìjúwe lórí ojúewé ìjúwe fáìlì rẹ̀ níbẹ̀ nìyí lábẹ́.
Àkótán
| ÌjúweEuropean Output of Books 500–1800.png |
Deutsch: Geschätzte europäische Buchproduktion von 500 bis 1800. Bei den Manuskripten sind einzelne Urkunden und Chartas nicht berücksichtigt. Ein gedrucktes Buch ist definiert als ein Druckwerk von mehr als 49 Seiten.
English: Estimated European output of books from 500 to 1800. Manuscripts do not include individual deeds and charters. A printed book is defined as printed matter containing more than 49 pages. |
| Ọjọ́ọdún | |
| Orísun |
Iṣẹ́ onítọ̀hún |
| Olùdá | Tentotwo |
| Àwọn àtẹ̀jáde míràn |
|

|
This graph image could be re-created using vector graphics as an SVG file. This has several advantages; see Commons:Media for cleanup for more information. If an SVG form of this image is available, please upload it and afterwards replace this template with
{{vector version available|new image name}}.
It is recommended to name the SVG file “European Output of Books 500–1800.svg”—then the template Vector version available (or Vva) does not need the new image name parameter. |
LaTeX source
\documentclass[border=5mm]{standalone}
\usepackage{pgfplots}
\usepackage[super]{nth}
\usepackage{amsmath}


\pgfplotstableread{
Siglos Manuscritos Libros impresos
6       13552           nan
7       10639           nan
8       43702           nan
9       201742  nan
10      135637  nan
11      212030  nan
12      768721  nan
13      1761951 nan
14      2746951 nan
%15   4999161 12589000
16       nan            217444000
17      nan             531941000
18      nan             983874000
}\datatable

\definecolor{RYB1}{RGB}{128, 177, 211}
\definecolor{RYB2}{RGB}{253, 180, 98}

\begin{document}
\begin{tikzpicture}
\begin{semilogyaxis}[
        axis on top=false, grid=both, xmajorgrids=false, every minor grid/.style=gray!20,
        axis lines*=left,
        width=12cm, height=8cm, enlarge x limits=0.05,
        ymin=1000, ymax=1e9,ytick={1000,1e4, 1e5, 1e6, 1e7, 1e8, 1e9},
        yticklabels={1000, 10\,000, 100\,000, 1\,000\,000, 10\,000\,000, 100\,000\,000, 1\,000\,000\,000},
        enlarge y limits=false,
        ybar=-10pt, xtick={6,...,18}, xticklabel={\pgfmathparse{int(\tick)}\nth{\pgfmathresult}},
        xlabel=Siglos, xlabel style={yshift=-1ex},ylabel=Número\\ de Copias,
        ylabel style={rotate=-90, align=left, anchor=east, xshift=-4ex, name=ylabel},
        after end axis/.code={
                \node [
                        font=\large\bfseries,
                        text=RYB2!60!black, fill=white, fill opacity=0.85, text opacity=1,
                        anchor=center, inner xsep=1pt]  at (axis cs:11,5e3) {Manuscritos};
                \node [
                        font=\large\bfseries, inner xsep=1pt,
                        text=RYB1!60!black,
                        fill=white, fill opacity=0.85, text opacity=1,
                        align=center, anchor=center]  at (axis cs:16.6,5e3) {Libros impresos};\
        },
        title={Producción Europea occidental de libros entre los años 500 y 1800$^{\text{\tiny{*}}}$},
        title style={font=\large\bfseries, align=center}
        ]

        \addplot +[fill=RYB1, draw=RYB1!50!black] table [y=Books] {\datatable};
        \addplot +[fill=RYB1, draw=RYB1!50!black, /pgf/bar shift=2.5pt] coordinates {(15,12589000)};
        \addplot +[fill=RYB2, draw=RYB2!50!black] table {\datatable};
        \addplot +[fill=RYB2, draw=RYB2!50!black, /pgf/bar shift=-2.5pt] coordinates {(15,4999161)};
        \draw (rel axis cs:0,0) -- (rel axis cs:1,0);
\end{semilogyaxis}
\node (annotation) at (current axis.below south west) [inner xsep=0pt, anchor=north west, align=left, font=\tiny] {$^*$without Southeast Europe (Byzantine, later Ottoman realm) and Russia};

\end{tikzpicture}
\end{document}
Ìwé àṣẹ
Èmi gangan, tó jẹ́ pé èmi ni mo ni ẹ̀tọ́àwòkọ iṣẹ́ yìí, fara mọ́ ọ láti tẹ̀ẹ́jáde lábẹ́ ìwé-àṣẹ ìsàlẹ̀ yìí:
Fáìlì yìí wà lábẹ́ ìwé àṣẹ Creative Commons Ìdálórúkọ-Share Alike 3.0 Aláìkówọlé.
- Ẹ ní ààyè:
- láti pín pẹ̀lú ẹlòmíràn – láti ṣàwòkọ, pínkiri àti ṣàgbéká iṣẹ́ náà
- láti túndàpọ̀ – láti mulò mọ́ iṣẹ́ míràn
- Lábẹ́ àwọn àdéhùn wọ̀nyí:
- ìdárúkọ – Ẹ gbọdọ̀ ṣe ọ̀wọ̀ tó yẹ, pèsè ìjápọ̀ sí ìwé-àṣe, kí ẹ sì sọ bóyá ìyípadà wáyé. Ẹ le ṣe èyí lórísi ọ̀nà tó bojúmu, sùgbọ́n tí kò ní dà bii pé oníìwé-àṣe fọwọ́ sí yín tàbí lílò yín.
- share alike – Tó bá ṣe pé ẹ ṣ'àtúndàlú, ṣàyípadà, tàbí ṣ'àgbélé sí iṣẹ́-ọwọ́ náà, ẹ lè ṣe ìgbésíta àfikún yín lábẹ́ ìwé-àṣẹ kannáà tàbí tójọra mọ́ ti àtilẹ̀wa.
akole
Ṣafikun alaye ila kan ti ohun ti faili yii duro
Awọn nkan ṣe afihan ninu faili yii
depicts Èdè Gẹ̀ẹ́sì
Diẹ ninu awọn iye lai a Wikidata ohun kan
copyright status Èdè Gẹ̀ẹ́sì
copyrighted Èdè Gẹ̀ẹ́sì
copyright license Èdè Gẹ̀ẹ́sì
source of file Èdè Gẹ̀ẹ́sì
original creation by uploader Èdè Gẹ̀ẹ́sì
15 Oṣù Ọ̀pẹ̀ 2011
Ìtàn fáìlì
Ẹ kan kliki lórí ọjọ́ọdún/àkókò kan láti wo fáìlì ọ̀ún bó ṣe hàn ní àkókò na.
| Ọjọ́ọdún/Àkókò | Àwòrán kékeré | Àwọn ìwọ̀n | Oníṣe | Àríwí | |
|---|---|---|---|---|---|
| lọ́wọ́ | 02:41, 22 Oṣù Ọ̀pẹ̀ 2011 |  | 1,436 × 953 (64 KB) | Tentotwo | Removed source text from image |
| 03:53, 16 Oṣù Ọ̀pẹ̀ 2011 |  | 1,455 × 953 (73 KB) | Tentotwo | Improved formatting | |
| 00:38, 15 Oṣù Ọ̀pẹ̀ 2011 |  | 1,260 × 799 (87 KB) | Tentotwo |
Ìlò fáìlì
Kò sí ojúewé tó únlo fáìlì yìí.
Jẹ́ kíkójáde láti "https://yo.wiktionary.org/wiki/Fáìlì:European_Output_of_Books_500–1800.png"


